HORTER INVESTMENT MANAGEMENT, LLC
Weekly Commentary horterinvestment.com July 16, 2018
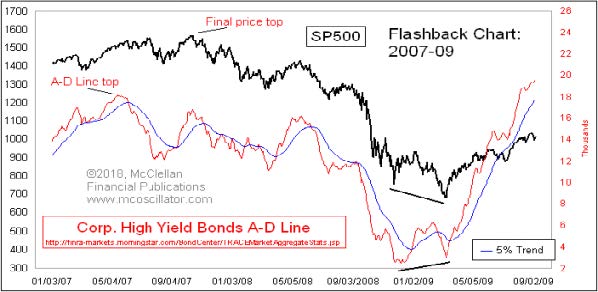
The Chart That Worries Me: HY Bond A-D Line
There is no divergence yet between stock indices and the NYSE’s composite A-D Line. But there is one in the High Yield Bonds A-D Line, and that is an early warning of big trouble to come.
High yield bonds usually trade more like stocks than like T-Bonds, and so that has led a lot of analysts to keep an eye on junk bond ETFs like HYG and JNK, especially if they show a divergence relative to stock price indices. Those ETFs tend to be dominated by high yield bonds that are related to oil exploration, and so the price of crude oil can move them around a bit.
The High Yield Bond A-D Line is more egalitarian, looking at the behavior of all of the high yield corporate bonds as tracked by FINRA. Each one gets an equal vote, which is why looking at A-D Lines can be useful in giving a different message than cap-weighted price indicators. And the High Yield Bonds A-D Line in particular can give us interesting indications early on that liquidity is starting to dry up.
High yield bonds are very risky, and thus they tend to be more sensitive to changes in financial market liquidity. We saw an example of this in 2015, when this A-D Line peaked in April 2015, well ahead of the ugliness for the SP500 which arrived later that year and in early 2016. Liquidity seemed to have been restored just after that February 2016 price bottom, and the High Yield Bonds A-D Line shot higher to demonstrate that refreshed liquidity condition.
This is The ‘Biggest Bubble in The History of Mankind and its Going to Burst,’
Look to the stock market and you’d assume Wall Street was doing just fine. The S&P 500 has come back to March highs, the Dow is back to positive for 2018, and the Nasdaq is at fresh records.
It’s all built on shaky foundations, said longtime market bear and former Republican Congressman Ron Paul.
This market is in the “biggest bubble in the history of mankind,”

and when it bursts, it could cut the stock market in half, he told CNBC’s “Futures Now” Thursday.
“I see trouble ahead, and it originates with too much debt, too much spending,” Paul said.
This isn’t the first time Paul has made such dire warnings. During a “Futures Now” appearance in August 2017, he predicted a 50 percent drop in the market, a call he has doubled down on a number of times since. Since that appearance, the S&P 500 has rallied 15 percent.
Paul belongs to the Libertarian Party, a faction that emphasizes constrained government spending. He sees federal spending and monetary policy as dual forces inflating a market bubble.
“The Congress spending and the Federal Reserve manipulation of monetary policy and interest rates — debt is too big, the current account is in bad shape, foreign debt is bad and it’s not going to change,” he said.

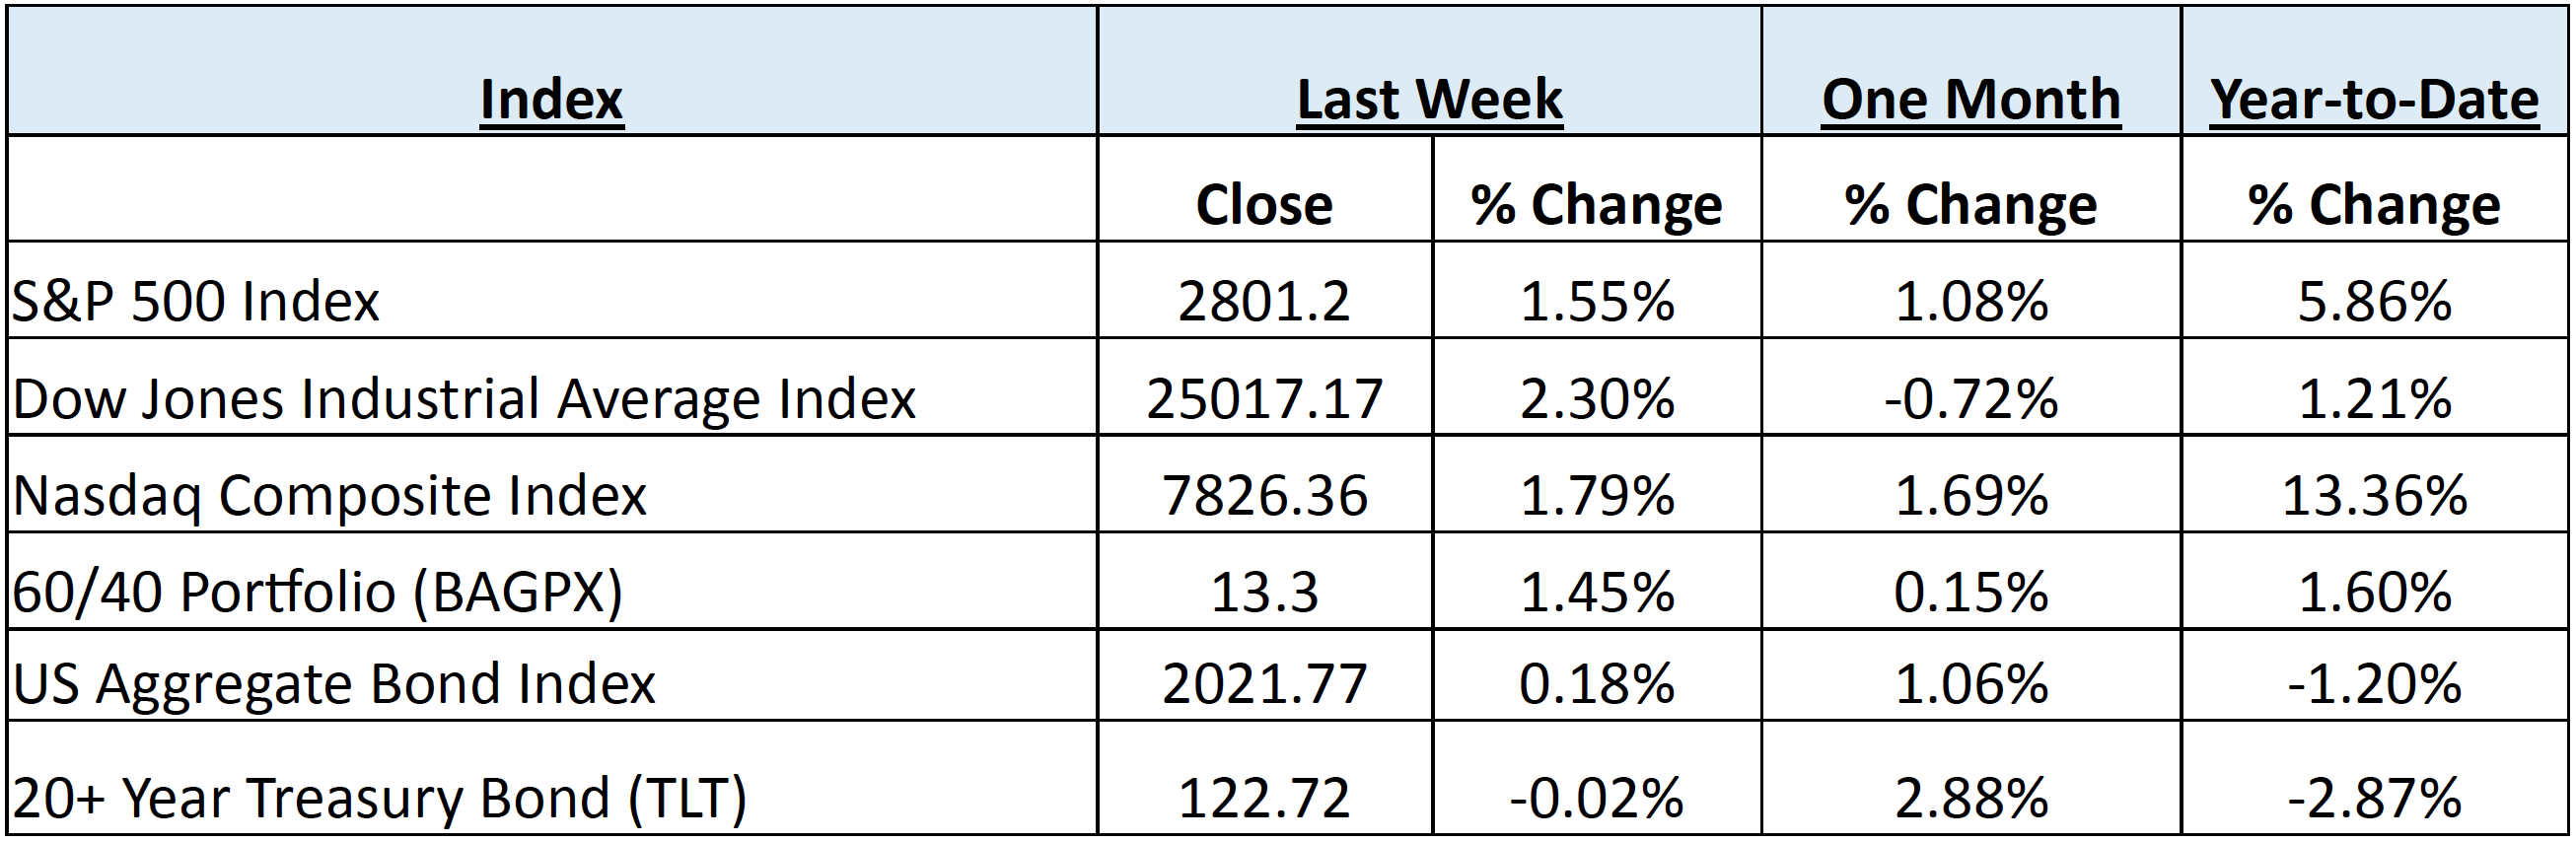
Taking a comprehensive look at the overall current stock market
Taking a comprehensive look at the overall current stock market, you can see the chart below representing eight major indices and their returns through the week ending July 16, 2018. In a truly diversified portfolio, the portfolio’s total return is determined by the performance of all of the individual positions in combination – not individually.
So, understanding the combined overall performance of the indices below, simply average the 6 indices to get a better overall picture of the market. The combined average of all 6 indices is 2.99% year to date.
Data Source: Investors FastTrack, Yahoo Finance
Past performance is not a guarantee of future results. This Update is limited to the dissemination of general information pertaining to its investment advisory services and is not suitable for everyone. The information contained herein should not be construed as personalized investment advice. There is no guarantee that the views and opinions expressed in this newsletter will come to pass. Investing in the stock and bond markets involves gains and losses and may not be suitable for all investors. Information presented herein is subject to change without notice. Horter has experienced periods of underperformance in the past and may also in the future. The returns represented herein are total return inclusive of reinvesting all interest and dividends.
The above equity, bond and cash weightings are targets and may not be the exact current weightings in any particular client account. Specifically, there may be cases where accounts hold higher cash levels than stated in these target weightings. This is usually to accommodate account level activity. Furthermore, some variable annuity and variable universal life accounts may not be able to purchase the exact weightings that we are indicating above due to specific product restrictions, limitations, riders, etc. Please refer to your client accounts for more specifics or call your Horter Investment Management, LLC at (513) 984-9933.
Investment advisory services offered through Horter Investment Management, LLC, a SEC-Registered Investment Advisor. Horter Investment Management does not provide legal or tax advice. Investment Advisor Representatives of Horter Investment Management may only conduct business with residents of the states and jurisdictions in which they are properly registered or exempt from registration requirements. Insurance and annuity products are sold separately through Horter Financial Strategies, LLC. Securities transactions for Horter Investment Management clients are placed through TCA by E*TRADE, TD Ameritrade and Nationwide Advisory Solutions.
For additional information about Horter Investment Management, LLC, including fees and services, send for our disclosure statement as set forth on Form ADV from Horter Investment Management, LLC using the contact information herein. Please read the disclosure statement carefully before you invest or send money.
Dow Jones – Week Ending
WEEKLY MARKET SUMMARY
Global Equities: Even as trade war fears remain, news of renewed negotiations taking place between the US and China was enough for equity markets to display their resilience. All three major US equity indices had positive returns, led by the Dow Jones Industrial Average gaining 2.25% for the week. The Nasdaq Composite and the S&P 500 also had nice gains, with weekly price returns of 1.7% and 1.4%, respectively. The Industrial sector outperformed all major S&P 500 sectors, as the SPDR Select Industrial Sector ETF (XLI) was up over 2.3%, while the Utility sector and its SPDR Select Sector ETF (XLU) lagged, down 1.25%. International equities continued the prior week’s momentum, as the iShares MSCI Emerging Markets Index ETF (EEM) gained .85%, and the International Developed market iShares MSCI EAFE Index Fund ETF (EFA) gained around .2%.
Fixed Income: The yield on the benchmark US 10-Year Treasury Note remains rangebound and nearly unchanged from the prior week, at a 2.83% yield. Though, while the longer 10-year bond yield is little changed, shorter-term yields continue to inch higher, as the 10-year vs. 2-year Treasury yield curve tightened near .25% and threatens to invert if there is another Federal Reserve interest rate hike. Spreads of high yield bonds over Treasury securities narrowed as well, as the iShares iBoxx High Yield Corporate Bond ETF (HYG) gained over .4% for the week. High yield bond mutual funds and ETF’s recorded inflows of $1.852 billion during the weekly period ended July 11th, per Lipper US Fund Flows.
Commodities: In what should have been a bullish report for crude oil prices, the EIA Petroleum Status Report of a 12.6-million-barrel drawdown of reserves sent Brent prices plunging
over 6% on Wednesday. Analysts attribute the move to the announcement that Libya will be ramping up production as their export terminals come back online. The price drop reduced the spread between the American benchmark West Texas Intermediate (WTI) and the International Brent Crude, ending the week near $71.19 and $75.56 per barrel, respectively. Oil prices are likely to remain volatile based on news flow, as there are many moving parts and interested parties. Natural Gas prices continued to decline, near $2.76/MMBtu.
WEEKLY ECONOMIC SUMMARY
MBA Mortgage Applications: According to the Mortgage Bankers Association (MBA), the weekly mortgage applications increased by a seasonally-adjusted 2.5% for the week ending July 6th. The Refinance Index continued to decline, down 4% from the prior week to its lowest level since December 2000. Refinancing activity has dropped to 34.8% of total applications, which is the lowest amount since 2008. Average contract rates for conforming mortgages ($453,100 or less) with an 80% loan-to-value ratio decreased to 4.76% from 4.79% a week earlier.
Consumer Price Index (CPI): The Bureau of Labor Statistics’ released inflation measure increased .1% for the month of June, while the year-on-year (YoY) increase was in line with consensus expectations at 2.9%. The energy component declined for the monthly period thanks to declines for electricity and natural gas offsetting an increase in prices of gasoline. The less volatile Core CPI, which removes changes for food and energy, was within the consensus range at .2% MoM and 2.3% YoY as prices for shelter, medical care, new and used vehicles, and recreation all increased. Prices for apparel, airline fares, and household furnishings declined for the month of June.
Q2 Earnings Season Begins: A handful of large banks kicked off Q2 earnings season on Friday with mixed results. JP Morgan (Ticker: JPM) and Citigroup (Ticker: C) reported higher earnings than analyst estimates, with the former setting a 2nd quarter record. Wells Fargo (Ticker: WFC), however, missed on the top and bottom line as they continue to deal with repercussions stemming from multiple scandals. Citigroup stock followed Wells Fargo lower in Friday’s trading, as analysts attributed the beat to tax and provisional gains. Post stress test promises of share buybacks and dividend hikes have done little to entice investors to the sector this year, with the SPDR Select Financial Sector ETF (XLF) down around 2.5%, and thus far, earnings announcements have provided no respite.
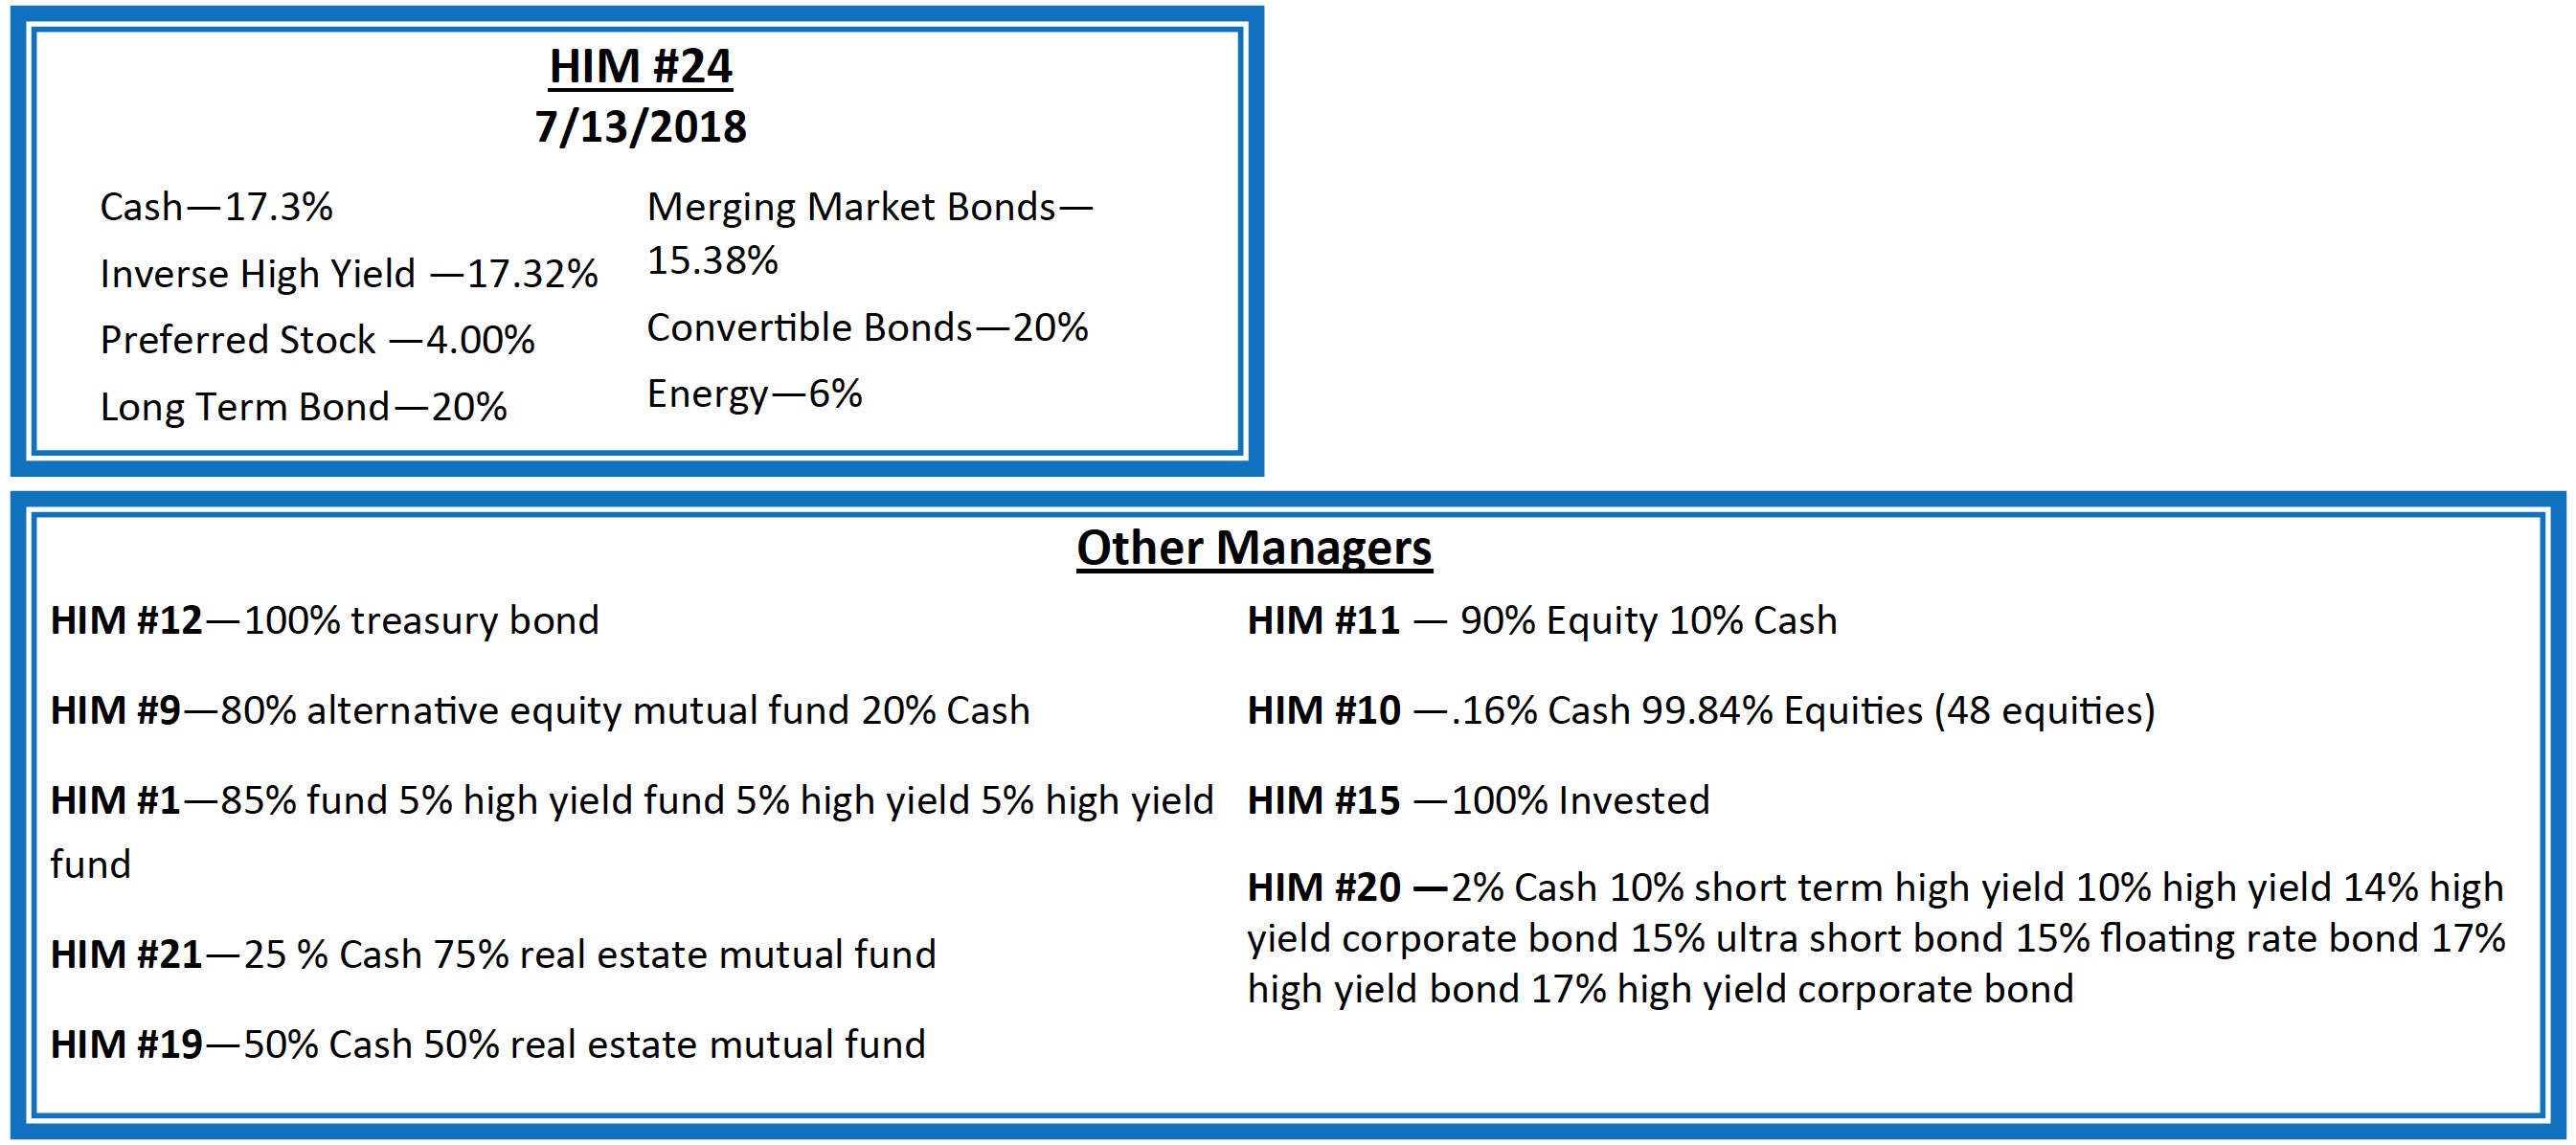
Current Model Allocations
Summary
In utilizing an approach that seeks to limit volatility, it is important to keep perspective of the activity in multiple asset classes. We seek to achieve superior risk-adjusted returns over a full market cycle to a traditional 60% equities / 40% bonds asset allocation. We do this by implementing global mandates of several tactical managers within different risk buckets. For those investors who are unwilling to stomach anything more than minimal downside risk, our goal is to provide a satisfying return over a full market cycle compared to the Barclays Aggregate Bond Index. At Horter Investment Management we realize how confusing the financial markets can be. It is important to keep our clients up to date on what it all means, especially with how it relates to our private wealth managers and their models. We are now in year nine of the most recent bull market, one of
the longest bull markets in U.S. history. At this late stage of the market cycle, it is extremely common for hedged managers to underperform, as they are seeking to limit risk. While none of us know when a market correction will come, even though the movement and volatility sure are starting to act like a correction, our managers have been hired based on our belief that they can accomplish a satisfying return over a full market cycle, – while limiting risk in comparison to a traditional asset allocation approach. At Horter we continue to monitor all of the markets and how our managers are actively managing their portfolios. We remind you there are opportunities to consider with all of our managers. Hopefully this recent market commentary is helpful and thanks for your continued trust and loyalty.